17. Set up security monitoring(IDS,logging,SIEM,dashboard)
Introduction
For the processes and protocols of an organisation, having a SIEM is one of the starting points to ensure good information security. Not only does this tool usually describe the
playbook but it also entails what steps need to be taken in order to safeguard the security of an enterprise.During my internship last year at the TU/Eindhoven I worked as a SoC analyst and engineer. This internship gave me a broad scale of experience with Blue team security operation center solutions; one of the tasks I completed for example was adjusting the architecture of the existing SoC. The SoC existed of multiple components, one of them being Security Onion. This security stack is something I enjoyed working on/with. Thus I decided to implement this in my own network as well and use it as a learning goal.

Execution
In my own instance of Security Onion, a SIEM tool called TheHive is included - it is possible to escalate a new alert from the Security Onion dashboard - resulting in the creation of a case in The Hive. Below you will find an example

The Hive
I rarely use The Hive in my own private lab because it is tough to maintain this and have a good overview of the baseline of the security in a network. Here are my current cases:

Though in our group assignment, which also revolves around blue-teaming activities, we do have cases - some of these contain partials to certain flags and whatnot.

Kibana
For our group assigment, prior to my discovery to the Wazuh event tab, I was convinced we needed to create our own dashboard in Kibana; and that’s what I did - this is based on KQL (Kibana Query Language). I took Suricata as an example

And here’s the default Security Onion Kibana dashboard, as you can see, it has certain use-cases.

Setup
There’s a fair bit of information in the about page of these docs; but you will find a summary in this paragraph. I decided not to use the seclab provided by the college as I have little faith in the performance of this lab, and instead decided to use my own lab to implement Security Onion. Below you will see the current architecture of my lab.
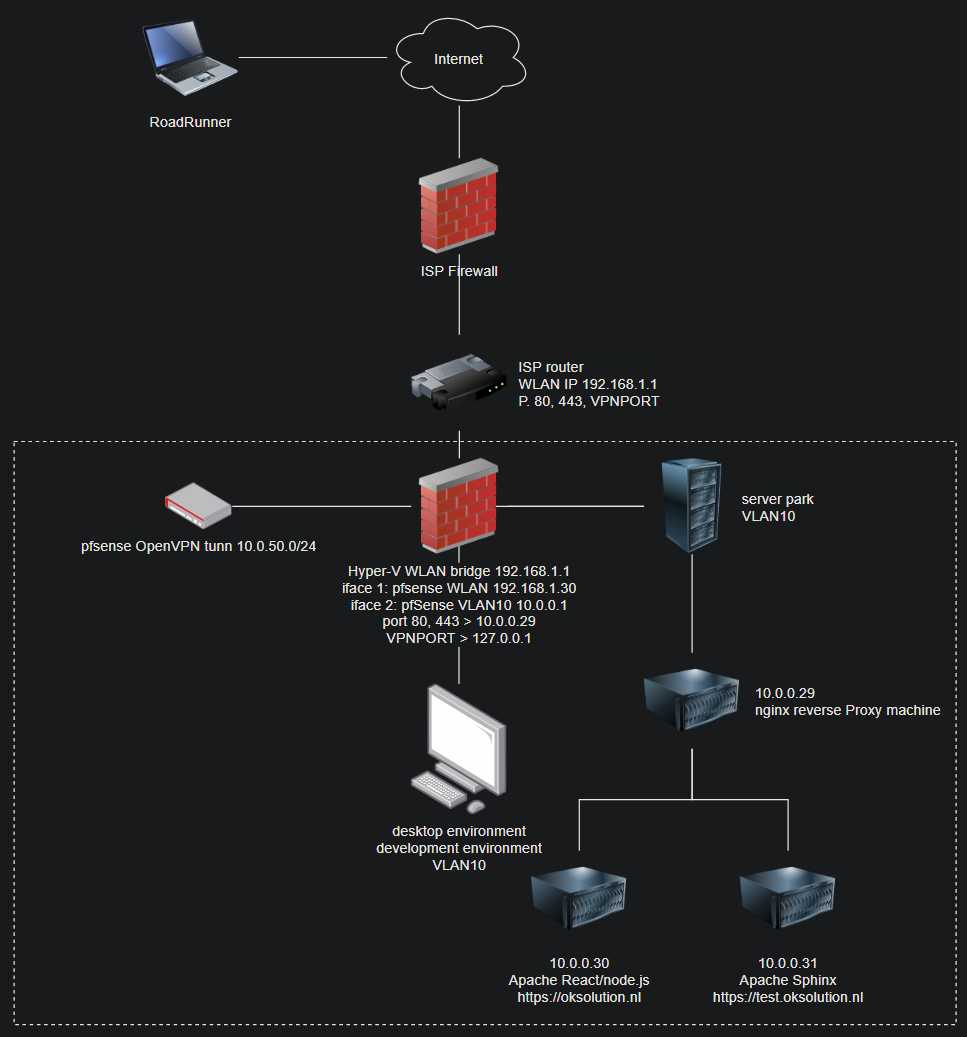
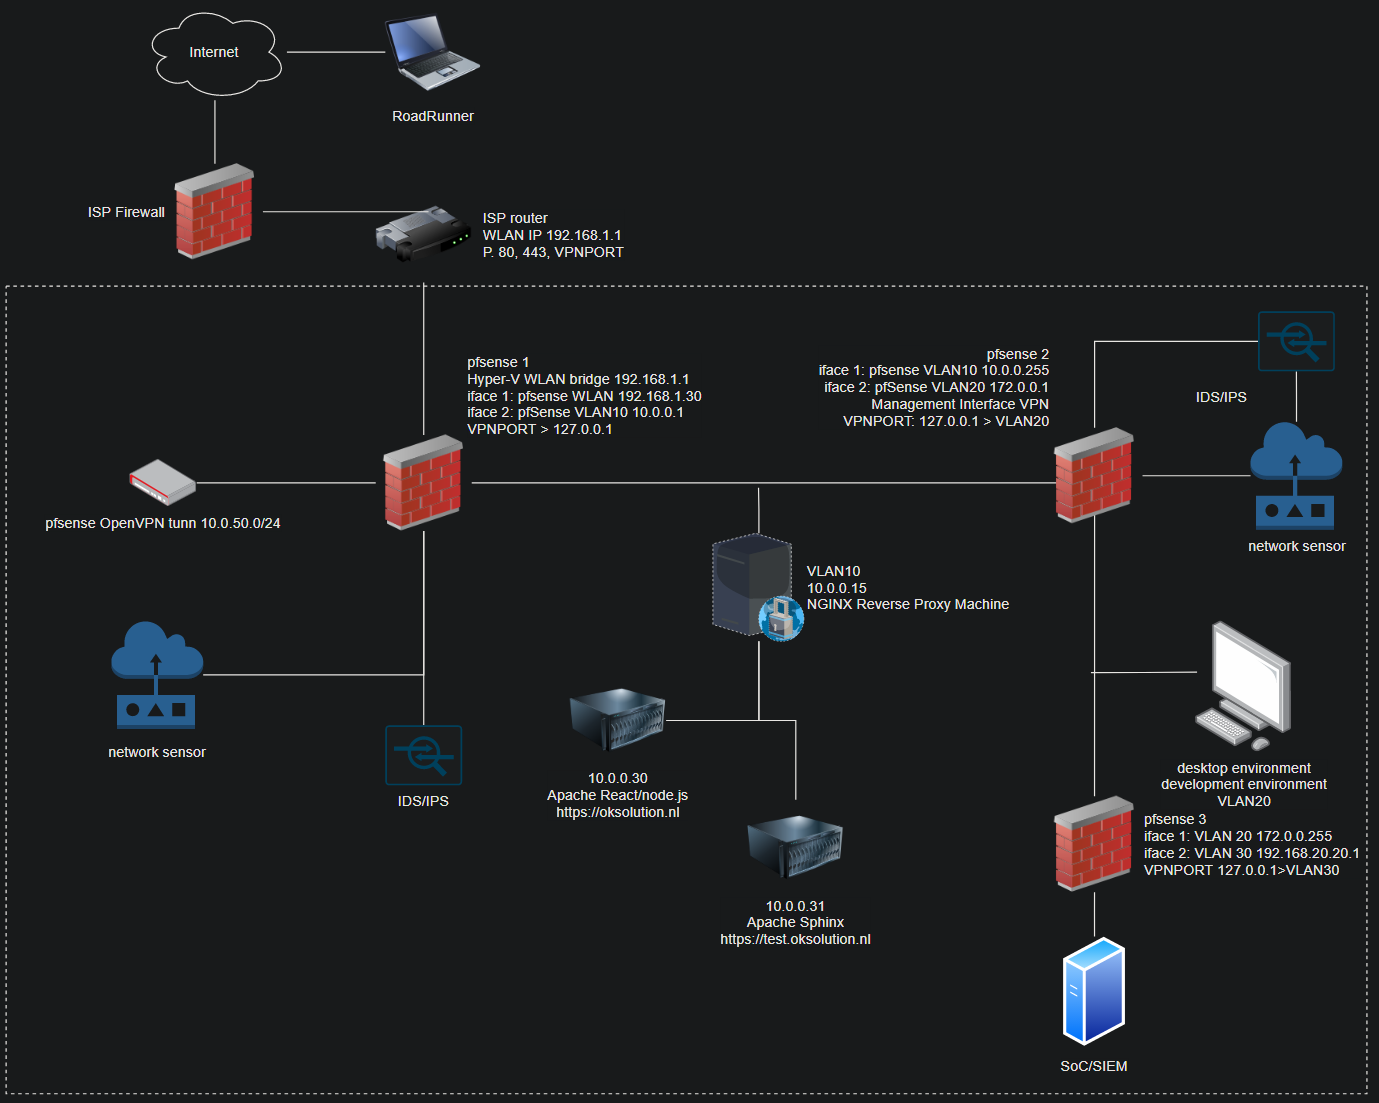
I agree with the consensus that this architecture isn’t ideal from a security POV. Why? The network segmentation isn’t present that well; the intention of this network is to guard the network devices that are in the WAN of my home router from being messed with in case a breach occurs. A more improved set-up would have the following setup:
Distributed deployment
There’s various ways of deploying Security Onion; most of my peers run it in standalone mode. In this modus, it is possible to run Security Onion on a single machine – which will then perform all of the tasks required. What tasks does Security Onion carry out?
Making data index-able and generally managing it in a conventional manner
As a sensor it can detect malicious traffic, anomalies, and various other suspicious traffic
Display alerts & being able to register incidents and launch an incidence response
And many more; but these are the core functionalities of Security Onion, and in a standalone setup it does all of these tasks on a single machine. In a real world scenario, this is not recommended – it is better to seperate these tasks and use individual machines that are responsible for this that way the entire system can be scale-able.
That is why I will install Security Onion in a Distributed way; because of scaleability and being more close real-life.
Manager node
Installing Security Onion can be relatively easy if the so-setup doesn’t run into any problems. Most beginners will have issues with the setup likely due to the network setup of their virtual manager. My Security Onion manager will have 1 NIC, that being the vlan 10.

The manager node hosts few services, such as the SoC dashboard software (the display that overviews alerts being generated); and generally be the master in the salt setup. What does this mean? Well; Security Onion uses an architect called Salt – it can be comparible to Chef and Puppet. It allows for a SoC engineer to send commands to slaves. This is useful because for example, if the customer requests a custom Suricata rule to be added (maybe they’re a software engineering company with a custom application) it can be easily done by forcing the update through the master which will then update the slaves automatically.
Search node
This node is also known as the
data node; most of the data gathered will be stored in this node and be index-able through Elastic.
Forward node
Also known as the
sensor node, this node is rsponsible for picking up suspicious traffic, malware, and any anomalies. It does this by using Suricata and Zeek; in which there’s an implementation of ET Open (free) that can find and match patterns of incoming and outgoing traffic.Proof of concept
When setup was completed, I decided it was time to test out the efficacy of the entire stack; to see if the entire environment was operational. My testing metholodogy involves using a known
malware-bomb and replaying it. The goal of this test was to see if the stack was working end 2 end.The first thing I checked was whether the grid was operational.

Then I downloaded the infected malware and begun replaying it to see if the alerts were going to get triggered. Here’s a list of malware you can download to perform a similar test: SecOnion Docs
tcpreplay -i bond0 2020-09-16-Qakbot-infection-traffic.pcap
tcpreplay -i bond0 maccdc2012_00000.pcap
Breakdown
tcpreplay is linux software that enables full packet replay-i specifies the interface in which the packet needs to be replayed onbond0 is the sniffing interface of the sensor node, replaying it on this interface allows it to be scanned by Suricata and Zeek2020-09-etc. is a malware bomb that upon replaying should generate loads of alerts
After submitting the command, it is advised to
ctrl+c after a few seconds since it will infinitely replay the packets otherwise. Doing this on SecLab is detrimental, and you could effectively bring the entire environment offline if using a malware bomb as shown above - this is one of the reasons I wanted to deploy this on my home lab.Test results

As shown on the screenshot above, the entire stack is fully operational and works as intended. The downside of running this 24/7 is the extremely high RAM/CPU usage; so I turn it on occasionally to test features and expand the architecture.
In order to make sure the architecture was working I checked in my kibana dashboard for the alert information; where it was being generated and whatnot. I noticed it was properly saved in the data node.
